
R410A Pressure Temperature Chart: Complete HVAC Guide for Technicians
Refrigerant pressure and temperature relationships are essential concepts in HVAC systems. Among modern refrigerants, R410A is one of the most widely used refrigerants in residential and commercial air conditioning systems.
HVAC technicians frequently rely on an R410A pressure temperature (PT) chart to diagnose refrigeration systems, measure superheat and subcooling, and ensure proper system performance.
Understanding how pressure relates to temperature in refrigerant systems allows technicians to identify issues such as:
-
Refrigerant undercharge
-
Refrigerant overcharge
-
Airflow problems
-
Compressor issues
This comprehensive guide explains the R410A pressure temperature chart, how to read it, why it is important, and how HVAC professionals use it for troubleshooting.
What Is R410A Refrigerant?
R410A is a hydrofluorocarbon (HFC) refrigerant commonly used in modern air conditioning and heat pump systems.
It was introduced as a replacement for older refrigerants such as R22, which were phased out due to environmental concerns.
R410A offers several advantages including:
-
Higher efficiency
-
Better heat transfer performance
-
Zero ozone depletion potential
-
Compatibility with modern HVAC equipment
Because R410A operates at higher pressure levels, HVAC systems designed for this refrigerant use stronger components and specialized tools.
Why the R410A Pressure Temperature Chart Is Important
The pressure and temperature relationship of a refrigerant determines how efficiently a cooling system operates.
A pressure temperature chart allows HVAC technicians to determine the saturation temperature of refrigerant at a specific pressure.
This information helps technicians:
-
Verify correct system operation
-
Calculate superheat
-
Measure subcooling
-
Diagnose refrigerant charge issues
Without a PT chart, accurate system diagnostics would be difficult.
Understanding Refrigerant Pressure and Temperature
In refrigeration systems, pressure and temperature are directly related.
When refrigerant pressure increases, the temperature also increases.
When pressure decreases, the temperature drops.
This relationship is fundamental to the refrigeration cycle.
The relationship between pressure and temperature determines how refrigerant changes between liquid and vapor states.
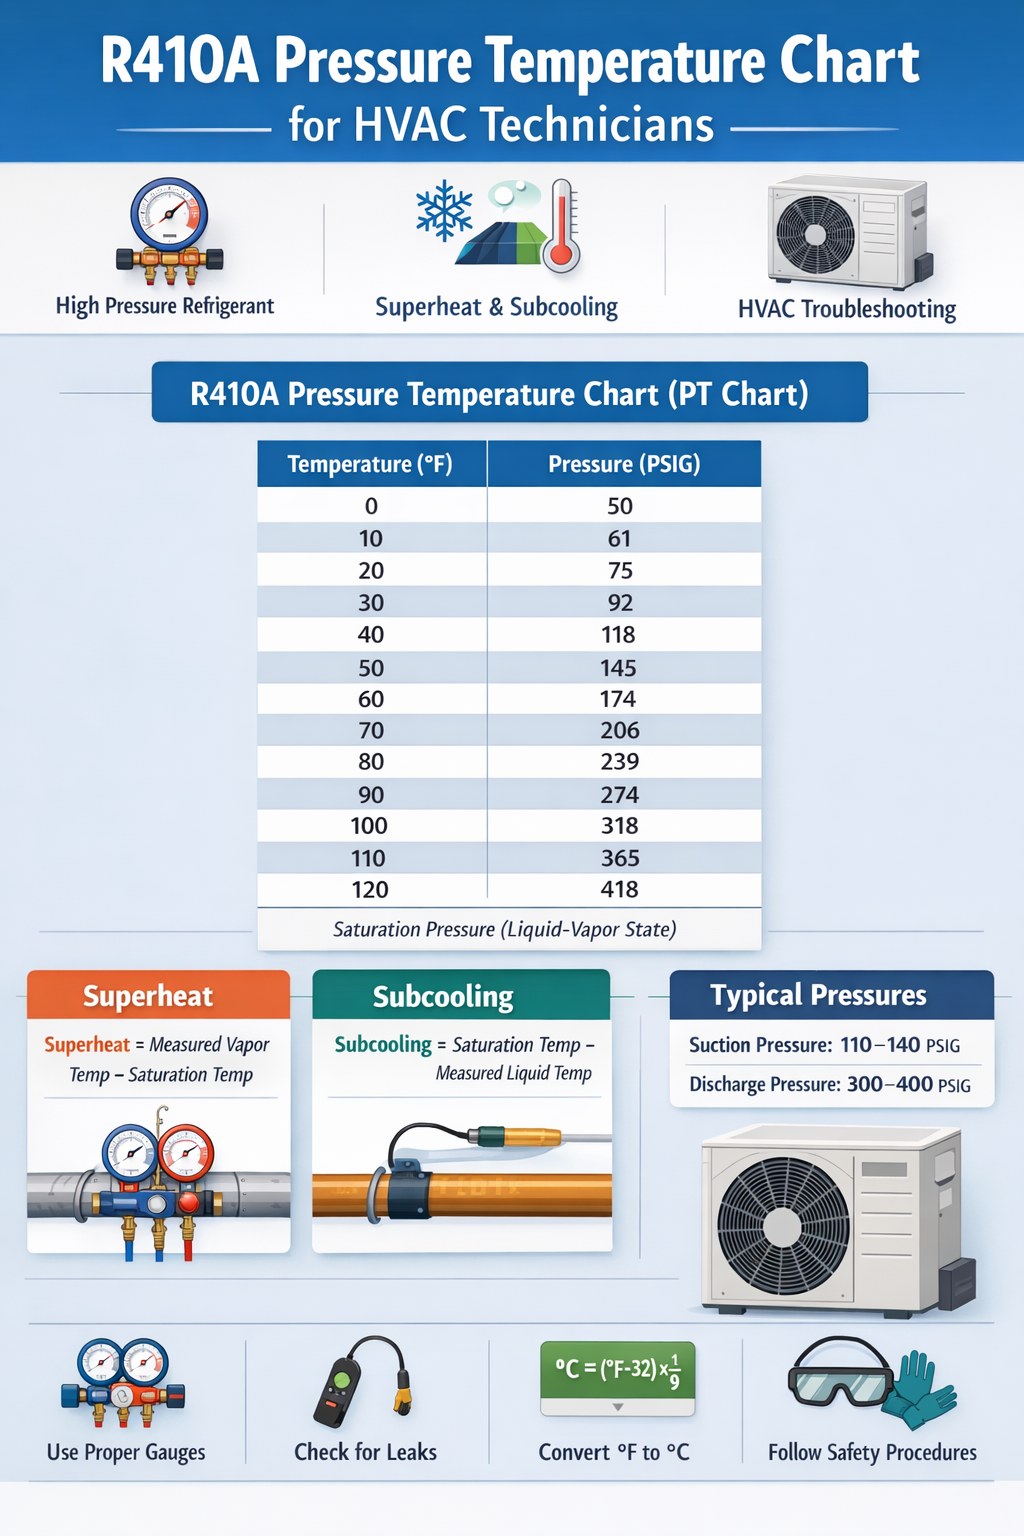
R410A Pressure Temperature Chart
Below is a simplified R410A pressure temperature chart commonly used by HVAC technicians.
| Temperature (°F) | Pressure (PSIG) |
|---|---|
| 0°F | 50 |
| 10°F | 61 |
| 20°F | 75 |
| 30°F | 92 |
| 40°F | 118 |
| 50°F | 145 |
| 60°F | 174 |
| 70°F | 206 |
| 80°F | 239 |
| 90°F | 274 |
| 100°F | 318 |
| 110°F | 365 |
| 120°F | 418 |
These values represent saturation pressure, which means the refrigerant is at the point where liquid and vapor coexist.
How the R410A PT Chart Works
The pressure temperature chart shows the relationship between pressure and the saturation temperature of R410A refrigerant.
For example:
If the gauge pressure reads 118 PSIG, the corresponding saturation temperature is approximately 40°F.
Technicians use this information to evaluate the cooling system.
Converting Fahrenheit to Celsius
In many regions, technicians use Celsius instead of Fahrenheit.
The temperature conversion formula is:
This allows HVAC professionals to convert PT chart values when needed.
R410A Operating Pressure
R410A operates at significantly higher pressures than older refrigerants.
Typical operating pressures include:
Suction Pressure
Approximately 110–140 PSIG depending on indoor conditions.
Discharge Pressure
Typically 300–400 PSIG depending on outdoor temperature.
These values can vary depending on system load and climate.
How HVAC Technicians Use the R410A PT Chart
HVAC technicians use the PT chart during system servicing and diagnostics.
Checking Refrigerant Charge
The PT chart helps determine whether the system is undercharged or overcharged.
For example:
-
Low pressure may indicate low refrigerant.
-
High pressure may indicate overcharging or airflow problems.
Calculating Superheat
Superheat measures the temperature of refrigerant vapor above its saturation temperature.
Superheat calculation:
Superheat = Actual suction line temperature – Saturation temperature.
Superheat helps ensure that liquid refrigerant does not enter the compressor.
Calculating Subcooling
Subcooling measures how much the liquid refrigerant temperature is below the saturation temperature.
Subcooling calculation:
Subcooling = Saturation temperature – Liquid line temperature.
Proper subcooling indicates correct refrigerant charge.
Example R410A Superheat Calculation
Suppose:
Suction pressure = 118 PSIG
According to the PT chart, saturation temperature is 40°F.
If suction line temperature measured is 55°F, then:
Superheat = 55 – 40 = 15°F
This indicates the refrigerant is properly vaporized before entering the compressor.
Why Accurate Pressure Measurement Is Important
Accurate pressure measurement is critical when working with R410A systems.
Technicians use specialized tools including:
-
Digital manifold gauges
-
Refrigerant pressure gauges
-
Temperature clamps
These tools help obtain precise readings for system diagnostics.
Differences Between R410A and R22 PT Charts
R410A replaced the older R22 refrigerant in many HVAC systems.
However, the two refrigerants operate differently.
| Feature | R410A | R22 |
|---|---|---|
| Pressure | Higher | Lower |
| Efficiency | Higher | Moderate |
| Environmental Impact | No ozone depletion | Ozone damaging |
| System Design | Modern systems | Older systems |
Because R410A operates at higher pressure, technicians must use gauges rated for R410A.
Common Problems Detected Using the PT Chart
The pressure temperature chart helps identify several system problems.
Low Refrigerant Charge
Low pressure readings combined with low saturation temperature may indicate a refrigerant leak.
Symptoms include:
-
Poor cooling performance
-
Ice buildup on evaporator coil
-
Long compressor run times
Overcharged System
Excess refrigerant can cause high pressure and reduced efficiency.
Symptoms include:
-
High discharge pressure
-
Increased energy consumption
-
Reduced cooling capacity
Airflow Problems
Restricted airflow across the evaporator coil can affect refrigerant pressure.
Causes include:
-
Dirty air filters
-
Blocked vents
-
Fan issues
Importance of Proper Refrigerant Handling
Handling refrigerants requires proper training and certification.
Technicians must follow safety procedures when working with R410A systems.
Safety practices include:
-
Wearing protective equipment
-
Using certified recovery equipment
-
Avoiding refrigerant release into the atmosphere
R410A Replacement Refrigerants
Environmental regulations are encouraging the transition to newer refrigerants.
Some alternatives include:
-
R32
-
R454B
-
R466A
These refrigerants offer lower global warming potential.
Future of Refrigerants in HVAC Systems
The HVAC industry continues to develop new refrigerants with lower environmental impact.
Future systems may use refrigerants with:
-
Lower global warming potential
-
Higher energy efficiency
-
Improved safety characteristics
Understanding pressure temperature relationships will remain essential for HVAC professionals.
Frequently Asked Questions (FAQ)
What is the R410A pressure temperature chart?
The R410A pressure temperature chart is a reference table used by HVAC technicians to determine the relationship between refrigerant pressure and saturation temperature. It helps diagnose system performance and calculate superheat and subcooling in air conditioning systems.
Why is the R410A PT chart important for HVAC technicians?
The R410A PT chart allows technicians to understand how refrigerant pressure corresponds to temperature inside the system. This helps in troubleshooting problems such as low refrigerant charge, overcharging, airflow issues, and improper system operation.
What is the normal operating pressure for R410A?
Typical R410A suction pressure ranges between 110 and 140 PSIG, while discharge pressure can range from 300 to 400 PSIG depending on indoor and outdoor temperature conditions.
How do you read an R410A pressure temperature chart?
To read an R410A PT chart, locate the measured refrigerant pressure on the chart and find the corresponding saturation temperature. This value is used to calculate superheat or subcooling for system diagnostics.
Can R410A systems use R22 pressure gauges?
No, R410A systems operate at much higher pressures than R22 systems. Using gauges designed for R22 may be unsafe. Technicians should always use gauges specifically rated for R410A refrigerant.
What tools are used to measure R410A pressure?
HVAC technicians typically use digital manifold gauges, pressure gauges, and temperature probes to measure refrigerant pressure and temperature when servicing R410A air conditioning systems.
Conclusion
The R410A pressure temperature chart is an essential tool for HVAC technicians working with modern air conditioning systems.
It allows professionals to understand the relationship between refrigerant pressure and temperature, helping them diagnose system problems and maintain proper refrigerant charge.
By using PT charts, technicians can accurately calculate superheat and subcooling, ensuring that HVAC systems operate efficiently and reliably.
As the HVAC industry evolves with new refrigerants and technologies, understanding refrigerant pressure temperature relationships will remain a fundamental skill for technicians and engineers.
I all the time used to study post in news papers
but now as I am a user of web therefore from now I am using
net for articles or reviews, thanks to web.